

A desire for consolidated, and simplified operational oversight isn’t limited to just cloud infrastructure. Increasingly, customers ask us for a “single pane of glass” approach for also monitoring and managing their application portfolios.
These customers tell us that detection and investigation of application issues takes additional time and effort, due to the typical use of multiple consoles, tools, and sources of information such as resource usage metrics, logs, and more, to enable their DevOps engineers to obtain context about the application issue under investigation. Here, an “application” means not just the application code but also the logical group of resources that act as a unit to host the application, along with ownership boundaries for operators, and environments such as development, staging, and production.
Today, I’m pleased to announce a new feature of AWS Systems Manager, called Application Manager. Application Manager aggregates operational information from multiple AWS services and Systems Manager capabilities into a single console, making it easier to view operational data for your applications.
To make it even more convenient, the service can automatically discover your applications. Today, auto-discovery is available for applications running in AWS CloudFormation stacks and Amazon Elastic Kubernetes Service (EKS) clusters, or launched using AWS Launch Wizard. Applications can also be discovered from Resource Groups.
A particular benefit of automated discovery is that application components and resources are automatically kept up-to-date on an ongoing basis, but you can also always revise applications as needed by adding or deleting components manually.
With applications discovered and consolidated into a single console, you can more easily diagnose operational issues and resolve them with minimal time and effort. Automated runbooks targeting an application component or resource can be run to help remediate operational issues. For any given application, you can select a resource and explore relevant details without needing to leave the console.
For example, the application can surface Amazon CloudWatch logs, operational metrics, AWS CloudTrail logs, and configuration changes, removing the need to engage with multiple tools or consoles. This means your on-call engineers can understand issues more quickly and reduce the time needed to resolve them.
Exploring an Application with Application Manager
I can access Application Manager from the Systems Manager home page. Once open, I get an overview of my discovered applications and can see immediately that there are some alarms, without needing to switch context to the Amazon CloudWatch console, and some operations items (“OpsItems”) that I might need to pay attention to. I can also switch to the Applications tab to view the collections of applications, or I can click the buttons in the Applications panel for the collection I’m interested in.
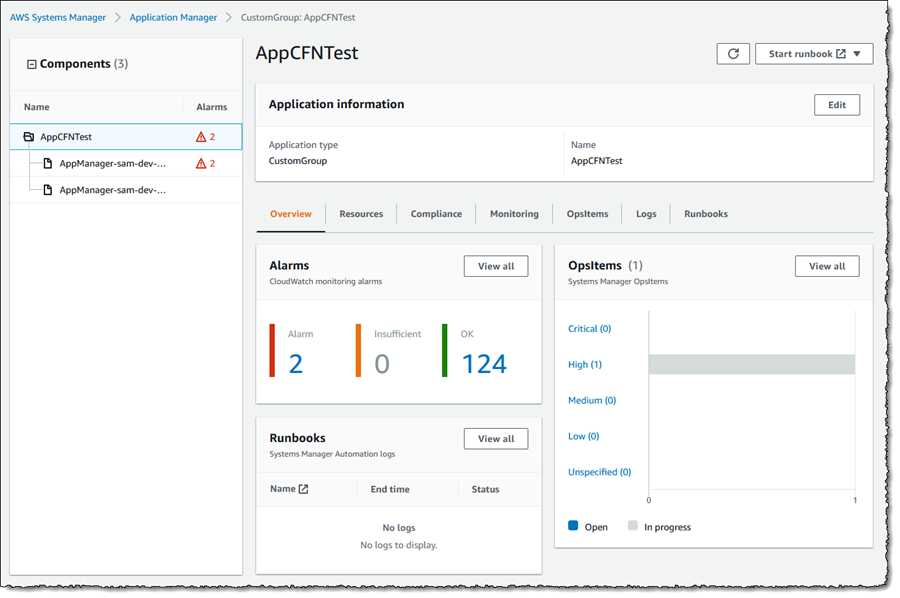
In the screenshot below, I’ve navigated to a sample application and again, have indicators showing that alarms have raised. The various tabs enable me to drill into more detail to view resources used by the application, config resource and rules compliance, monitoring alarms, logs, and automation runbooks associated with the application.
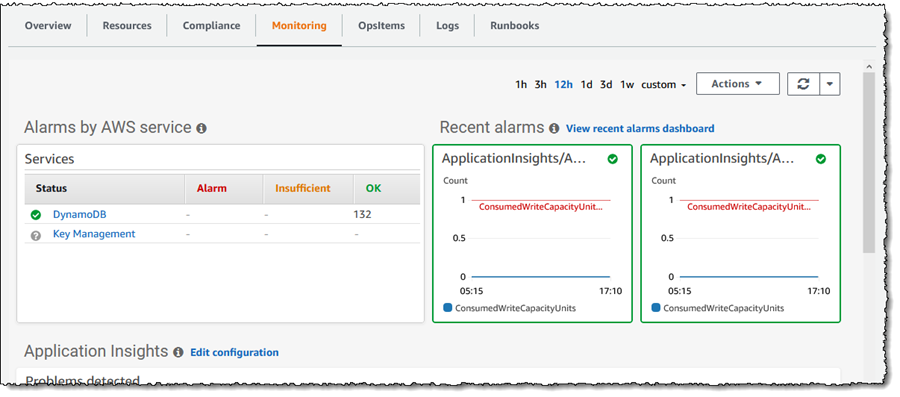
Clicking on the Alarm indicator takes me into the Monitoring tab, and it shows that the ConsumedWriteCapacityUnits alarm has been raised. I can change the timescale to zero in on when the event occurred, or I can use the View recent alarms dashboard link to jump into the Amazon CloudWatch Alarms console to view more detail.
The Logs tab shows me a consolidated list of log groups for the application, and clicking a log group name takes me directly to the CloudWatch Logs where I can inspect the log streams, and take advantage of Log Insights to dive deeper by querying the log data.
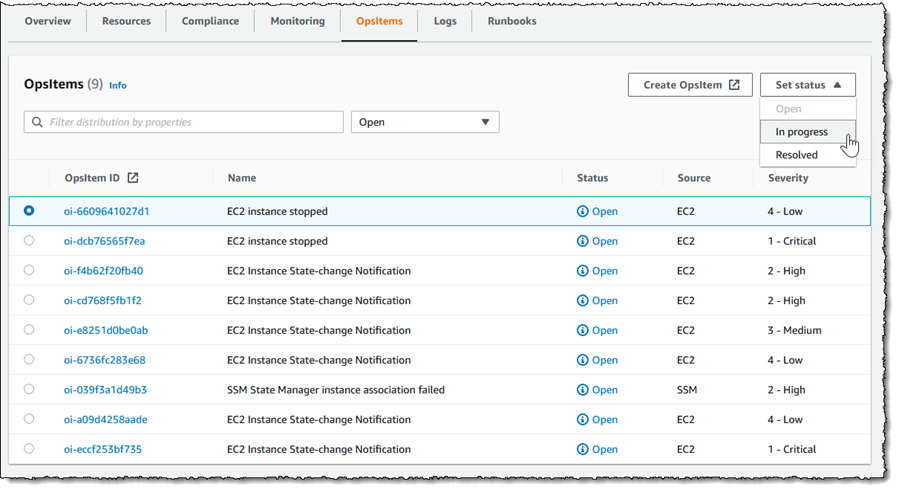
OpsItems shows me operational issues associated with the resources of my application, and enables me to indicate the current status of the issue (open, in progress, resolved). Below, I am marking investigation of a stopped EC2 instance as in progress.
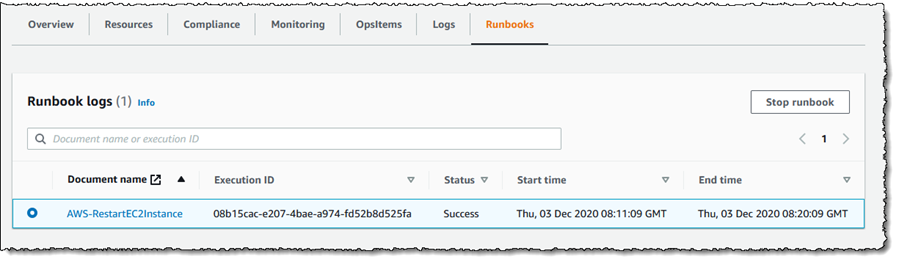
Finally, Runbooks shows me automation documents associated with the application and their execution status. Below, it’s showing that I ran the AWS-RestartEC2Instance automation document to restart the EC2 instance that was stopped, and I would now resolve the issue logged in the OpsItems tab.
Consolidating this information into a single console gives engineers a single starting location to monitor and investigate issues arising with their applications, and automatic discovery of applications and resources makes getting started simple. AWS Systems Manager Application Manager is available today, at no extra charge, in all AWS Commercial Regions, AWS GovCloud (US), and AWS China Regions.
Learn more about Application Manager and get started at AWS Systems Manager.


 inspection limit & size enforcement")


