

To balance costs, while at the same time ensuring the service levels needed to meet business requirements are met, some customers elect to continuously monitor and optimize their AWS Lambda functions. They collect and analyze metrics and logs to monitor performance, and to isolate errors for troubleshooting purposes. Additionally, they also seek to right-size function configurations by measuring function duration, CPU usage, and memory allocation. Using various tools and sources of data to do this can be time-consuming, and some even go so far as to build their own customized dashboards to surface and analyze this data.
We announced Amazon CloudWatch Lambda Insights as a public preview this past October for customers looking to gain deeper operational oversight and visibility into the behavior of their Lambda functions. Today, I’m pleased to announce that CloudWatch Lambda Insights is now generally available. CloudWatch Lambda Insights provides clearer and simpler operational visibility of your functions by automatically collating and summarizing Lambda performance metrics, errors, and logs in prebuilt dashboards, saving you from time-consuming, manual work.
Once enabled on your functions, CloudWatch Lambda Insights automatically starts collecting and summarizing performance metrics and logs, and, from a convenient dashboard, provides you with a one-click drill-down into metrics and errors for Lambda function requests, simplifying analysis and troubleshooting.
Exploring CloudWatch Lambda Insights
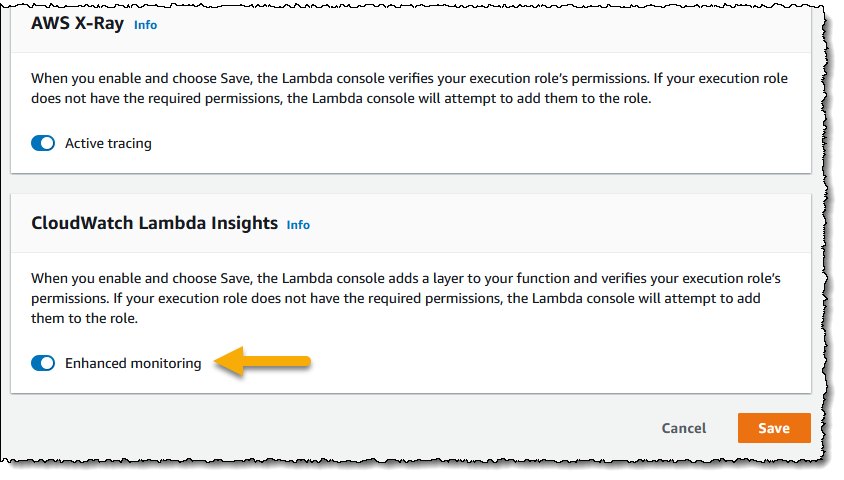
To get started, I need to enable Lambda Insights on my functions. In the Lambda console, I navigate to my list of functions, and then select the function I want to enable for Lambda Insights by clicking on its name. From the function’s configuration view I then scroll to the Monitoring tools panel, click Edit, enable Enhanced monitoring, and click Save. If you want to enable enhanced monitoring for many functions, you may find it more convenient to use AWS Command Line Interface (CLI), AWS Tools for PowerShell, or AWS CloudFormation approaches instead. Note that once enhanced monitoring has been enabled, it can take a few minutes before data begins to surface in CloudWatch.
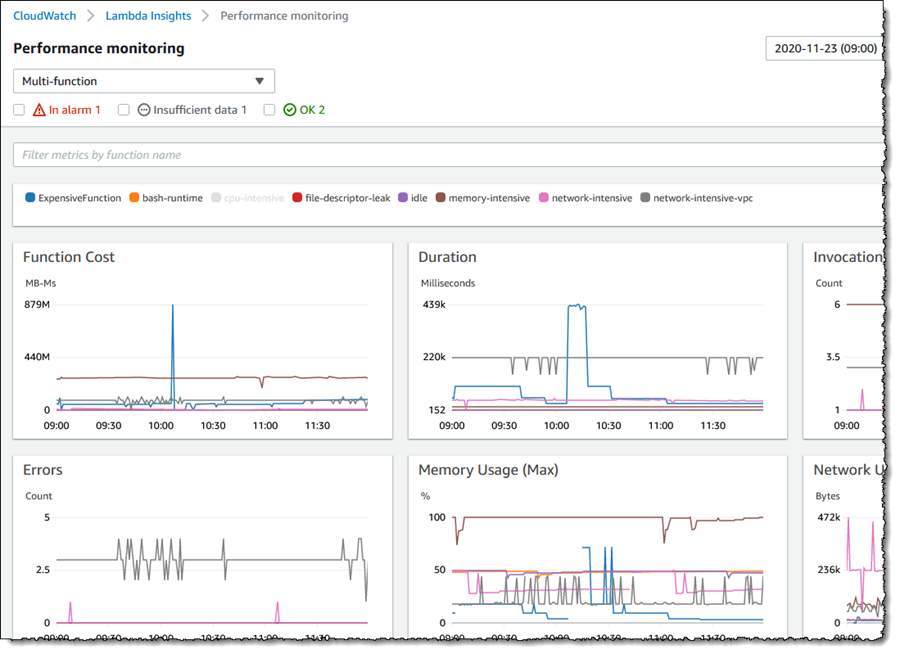
In the Amazon CloudWatch Console, I start by selecting Performance monitoring beneath Lambda Insights in the navigation panel. This takes me to the Multi-function view. Metrics for all functions on which I have enabled Lambda Insights are graphed in the view. At the foot of the page there’s also a table listing the functions, summarizing some data in the graphs and adding Cold starts. The table gives me the ability to sort the data based on the metric I’m interested in.
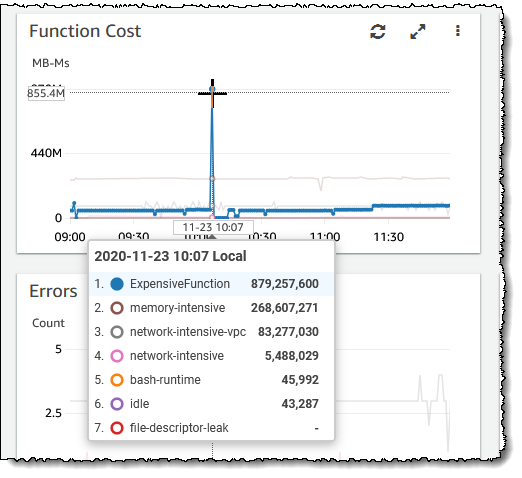
 An interesting graph on this page, especially if you are trying to balance cost with performance, is Function Cost. This graph shows the direct cost of your functions in terms of megabyte milliseconds (MB-MS), which is how Lambda computes the financial charge of a function’s invocation. Hovering over the graph at a particular point in time shows more details.
 Let’s examine my ExpensiveFunction further. Moving to the summary list at the bottom of the page I click on the function name which takes me to the Single function view (from here I can switch to my other functions using the controls at the top of the page, without needing to return to the multiple function view). The graphs show me metrics for invocations and errors, duration, any throttling, and memory, CPU, and network usage on the selected function and to add to the detail available, the most recent 1000 invocations are also listed in a table which I can sort as needed.
Clicking View in the Trace column of a request in the invocations list takes me to the Service Lens trace view, showing where my function spent its time on that particular invocation request. I could use this to determine if changes to the business logic of the function might improve performance by reducing function duration, which will have a direct effect on cost. If I’m troubleshooting, I can view the Application or Performance logs for the function using the View logs button. Application logs are those that existed before Lambda Insights was enabled on the function, whereas Performance logs are those that Lambda Insights has collated across all my enabled functions. The log views enable me to run queries and in the case of the Performance logs I can run queries across all enabled functions in my account, for example to perform a top-N analysis to determine my most expensive functions, or see how one function compares to another.
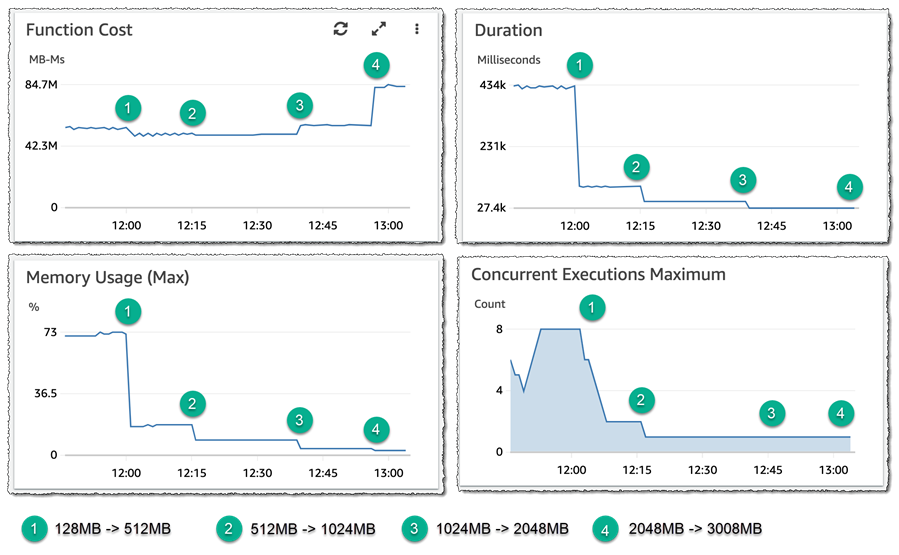
Here’s how I can make use of Lambda Insights to check if I’m ‘moving the needle’ in the correct direction when attempting to right-size a function, by examining the effect of changes to memory allocation on function cost. The starting point for my ExpensiveFunction is 128MB. By moving from 128MB to 512MB, the data shows me that function cost, duration, and concurrency are all reduced – this is shown at (1) in the graphs. Moving from 512MB to 1024MB, (2), has no impact on function cost, but it further reduces duration by 50% and also affected the maximum concurrency. I ran two further experiments, first moving from 1024MB to 2048MB, (3), which resulted in a further reduction in duration but the function cost started to increase so the needle is starting to swing in the wrong direction. Finally, moving from 2048MB to 3008MB, (4), significantly increased the cost but had no effect on duration. With the aid of Lambda Insights I can infer that the sweet spot for this function (assuming latency is not a consideration) lies between 1024MB and 2048MB. All these experiments are shown in the graphs below (the concurrency graph lags slightly, as earlier invocations are finishing up as configuration changes are made).
CloudWatch Lambda Insights gives simple and convenient operational oversight and visibility into the behavior of my AWS Lambda functions, and is available today in all regions where AWS Lambda is present.
Learn more about Amazon CloudWatch Lambda Insights in the documentation and get started today.


